


Closing Skills Gaps
Overview
In 2001, Strategic Human Capital Management (SHCM) was added to the U.S. Government Accountability Office (GAO) High Risk List.
Much was done from 2001 to 2011 to meet the GAO criteria and remove SHCM from the GAO High Risk List, however, SHCM remained on the High Risk List with closing skills gaps identified (by GAO) as the primary reason SHCM stayed on the list.
In 2011, OPM and the Chief Human Capital Officer (CHCO) Council took on the challenge of developing and implementing a strategy to remove SHCM from the GAO high risk list by focusing on closing skills gaps government-wide.
The focus of the closing skills gap effort was to develop a methodology to identify agency-specific and government-wide mission critical occupations (MCO) at the greatest risk, and implement strategies to close the gaps.
Related Information
Root Cause Analysis
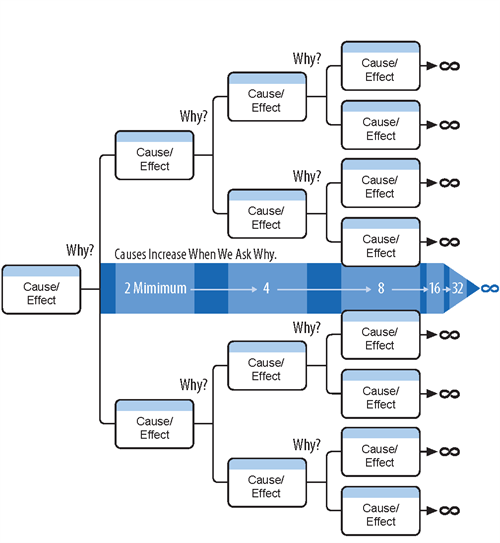
A key step in closing skills gaps is to identify the true “root cause” of the skills gap. This process is a deeper understanding of the problem. This process is used to delayer and develop a strategy to address the “cause”. The purpose of any root cause analysis (RCA) is to find effective solutions to problems so that they do not reoccur.
For example an agency may identify retention as a problem in a certain mission critical occupation (MCO) that is causing a skills gaps. In order to be able to address what is causing the retention issue we must conduct a root cause analysis to ensure that we are able to implement a strategy that will mitigate that gap. Simply saying we will address retention is not enough, what are the factors that are causing the issue. Examples could be inaccurate position description, office culture, location of the position, agency culture or a number of other factors. A root cause analysis will enable the agency to pinpoint the issue and strategically address that specific cause.
To better understand how to use and implement a root cause analysis please refer to section below.
Root Cause Identification
The purpose of any root cause analysis (RCA) is to find effective solutions to problems such that they do not reoccur. RCA is to be an investigative, data-driven approach to determine the foundation of problems and consequently inform where solutions might be found.
An effective RCA process should meet the following four criteria:
- Clearly defines the problem(s)
- Clearly establishes causal relationships between the root cause(s) and the defined problem
- Clearly delineates the known dynamics among those causal relationships on how they combined to cause the problem
- Clearly presents the evidence used to support the existence of identified causes
OPM recommends using one of the two following proven root cause analysis techniques, though we understand that there are other tools available a well.
Why Reality Charting
Ishikawa Fishbone Diagramming

Prioritization of Root Cause Analysis Results
Prioritization will be needed when you won’t be able to address every identified root cause and OPM recommends using the Multi-Voting or the Importance/Difficulty Matrix techniques to narrow down which root causes you will focus on. An example of an Importance/Difficulty Matrix can be found here.
Multi-Voting
- Used by groups to reduce a list from a large number to a more manageable number of items through a series of votes
- Aims to garner consensus around a feasible list of priorities (not used for consensus around a single option)
- Applied in many variations and is also referred to as N/3 voting, nominal prioritization, dot voting, and more
Importance/Difficulty Matrix
- Approaches decision-making based on relative return-on-investment by balancing the two competing forces
- Facilitates deliberation to resolve differences in opinion
Importance
The impact an item has on your problem statement and the extent to which addressing it could better the situation
vs.
Difficulty
The amount of effort, resources, and time potentially needed to address an item, including overcoming anticipated barriers
Action Planning
The action planning phase is the next step in the closing skills gaps methodology to be completed once the root cause analysis is completed. An action plan provides a detailed outline of the tasks required to accomplish a goal. It breaks down the process into actionable steps based on a given timeline.
It is critical that agencies are able to align specific actions to their root cause that includes milestones, who is responsible for ensuring the action or milestone is completed and a timeframe for completing the action.
How to complete the action plan:
- A separate table is used for each root cause selected through your prioritization process, as submitted in your RCA results;
- Causal linkages are also taken from your RCA results in how the root cause connects to your problem statement (e.g., risk factors);
- Strategies to address each root cause are listed in the rows below
- Actions: high level statements of what is planned (ex: "develop X policy")
- Milestones: detailed steps to be taken to fulfill actions (ex: "form workgroup," "compose first draft," "obtain feedback," etc.)
- Actions and milestones are numbered in a hierarchical format
- Action numbering: [root cause #] . [action #]
- Milestone numbering: [root cause #] . [action #] . [milestone #]
- List responsible parties and start-end dates for each milestone.
Metrics
Why we Measure:
- Quantifiable data is needed to determine if goals or objectives were achieved;
- Setting targets allows agencies to monitor progress through HRStat or other internal review processes;
- Measures allow agencies to take action to affect performance or improve efficiency if interventions are necessary; and
- Activities and milestones are important to detail how the objectives will be accomplished, but don’t indicate actual performance.
Developing a Metric:
- Must be quantifiable and have a defined baseline;
- Must have targets that can be measured;
- Must align to an goal, could be either strategic or operational.
Example of a good quantifiable metric:
| Metric | Baseline FY 17 | Baseline FY 18 | Baseline FY 19 |
|---|---|---|---|
|
Average TTH (Series GS-00XX) |
107 days | 102 days | 96 days |
| Average TTH (Series GS-00BB) Average time to hire for permanent GS-00BB occupation (from time action is created to EOD) |
118 days | 112 days | 107 days |
| Agency Average Time-to-Hire Average number of Days to hire agency wide |
106 days | 96 days | 85 days |
Monitoring
The final step of the closing skills gaps cycle is the monitoring element in which agencies monitor their progress in closing or mitigating skills gaps in their mission critical occupations.
Agencies monitor closing skills gaps efforts in a number of ways which include their quarterly HRStat reviews and as well as updating OPM through a quarterly reporting template.
Monitoring progress should link directly to the agency’s action plan which details planned actions, milestones and targets. It is important to understand if planned actions are having the desired affect and progress is being made.
See example (in related information) of how to connect your quarterly reporting to your action plan.
Related Information
Multi-Factor Model (MFM)
The multi-factor factor model is a standardized, data-driven approach that provides a consistent agency-level assessment for government-level synthesis. The multi-factor model was developed by OPM and agency workforce planning experts. The model was vetted and validated by an inter-agency workgroup consisting of workforce planning experts from across government. The model was then revised based on the feedback received from workgroup.
Additionally, the model was reviewed and approved by the closing skills gaps Executive Steering Committee (ESC) and sent for recommendation to the Chief Human Capital Officer (CHCO) Council for approval. The CHCO Council reviewed and approved the use of the multi-factor model.
The multi-factor model is used to identify agency-specific and Government-wide high risk mission critical occupations. The current model is comprised of 4 distinct factors, each having multiple dimensions that include government-wide comparable data, as well as occupation-specific data. The model is not intended to validate or determine agency-specific MCOs.
For more information on the multi-factor model please contact us at closingskillsgaps@opm.gov.