





Time for a Check-up
I’ve written previously about the need for regular pulse surveys in organizations to gauge key measures of employee engagement; consistency matters as do the trend lines of results over time. We are doing that at OPM with a quarterly check-in; it’s that time again.
As a reminder, the goals of the survey are to help us understand whether everyone understands how what they do ties into our organizational their objectives, whether we are creating an accountable culture that also rewards outstanding performance, whether we are following our cultural values and overall whether the organization is on track.
So, how are we doing?
First, I want to thank those of you who completed the survey. We had a 56% response rate – this was up from our starting point of 36%, but below our last quarterly number of 66%. This is a great response rate to enable us to draw meaningful conclusions, but I’d certainly like to see if we can continue to improve on this. If you are someone who didn’t participate, please feel free to let me know why – is it too burdensome; is everything so perfect that you don’t need to express your opinion (that’s a joke btw in case my humor didn’t come through); or do you just not care? Any and all reasons are valid!
Below you can see a graphic of the response rates by function.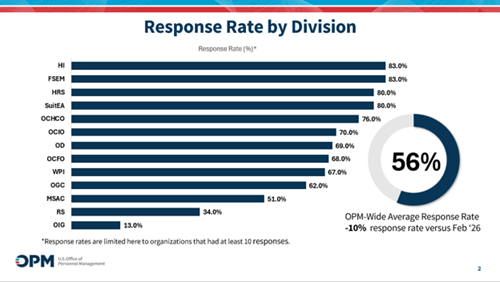
Now on to the key results.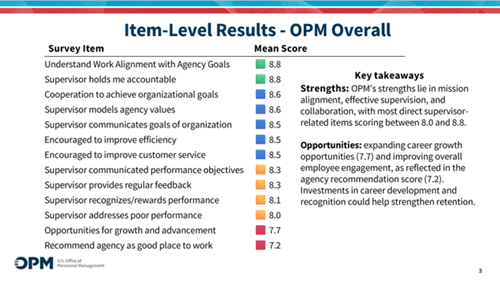
What is going well?
- The scores highlighted in green and blue are very good.
- Team members seem to understand what we are trying to accomplish as an organization and how their roles fit in with that.
- Managers are doing a good job at communicating our goals and upholding our core cultural values of efficiency, collaboration/team work and customer service.
- Individuals believe that their managers holds them accountable – more on this in a minute.
What do we need to work on?
- The scores highlighted in yellow and red illustrate the areas for improvement.
- These all boil down to the following – we have more to do in enforcing accountability for our under-performers, differentiating and rewarding outstanding performance and helping develop career paths for our top performers.
- The accountability one is interesting, as employees say that their manager holds them accountable, but not others. We’ll need to dig more into this, but for me it leads to the same conclusion – employees want to be in an environment where everyone is contributing meaningfully to the organizational outcomes. The good news is that we have been promulgating a number of new rules to highlight accountability and make it easier for managers to hold under-performers accountable, but we need to make sure we see the desired behavior.
- On the other end of the spectrum, we need to do more to differentiate outstanding performance and to reward and recognize when people go above and beyond – both in terms of actual rewards and in terms of career development. This is great to see in that it also reinforces our policy priorities – creating a high performance culture that doesn’t rank and reward everyone equally but rather recognizes truly outstanding performance. The new compensation and ratings rules that we have put in place for this year’s performance cycle will help us enforce this more effectively.
- While the absolute score on “would you recommend OPM as a great place to work” is very high as far as engagement surveys go, it still ranks ordinally at the bottom of the list. We are going to spend more time at the individual sub-organizational levels to better understand this – is it because we have so much change going on (in terms of re-orgs, etc.); is it because we have changed many of the day-to-day things around the office (e.g., we are consolidating floors to maximize building efficiency, but that also means people may have smaller workspaces); or something else?
What has changed (or not) over time?
We’ve now done this survey three times (although some of the questions changed from the initial survey), so we have the benefit of looking directionally at the results. This is helpful, since the time series data is more significant than the point-in-time results.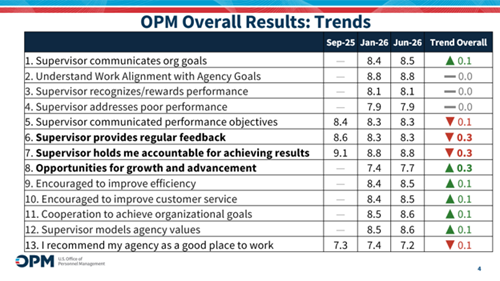
The good news is that most of the scores are consistent over time; the bad news is that most of the scores are consistent over time. The absolute scores of things that are going well are quite high for engagement surveys, so that might explain a little bit of our lack of upward trajectory on scores, but we do have room for improvement on the stuff that needs attention.
The red arrows highlight the areas that we know are of critical focus – namely accountability and feedback on how we’re doing. While opportunities for growth and advancement showed a trend upward from the last survey, this is still one of the lower items on the list. These item results are a good sign as it means we have a dedicated workforce that wants our help in sustaining a high-performance culture – and this is great for the American people as well. We need to deliver better on this.
We are investing heavily in AI
We have made a big investment in AI at OPM to help our team members develop their skills and to help improve the overall efficiency of our organization. And, as we’ve discussed, this efficiency is not about us looking to reduce costs further, but rather the means by which we can improve the quality of our service delivery and simply do more without having to increase headcount.
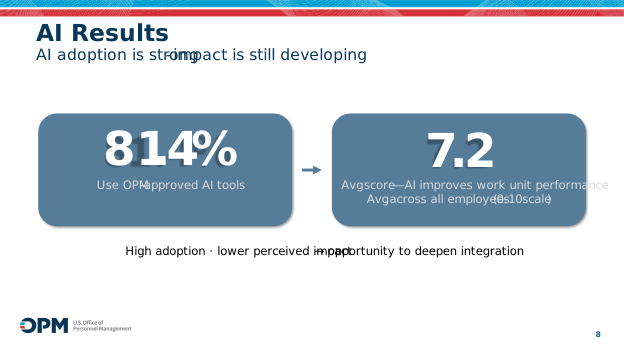
We wanted to get a sense of how we were doing on these goals, so we added a few AI adoption questions to the survey. As the following two slides show, overall we are doing a good job of helping people experiment with AI – more than 80% of employees report using AI in some capacity to help with their job. Of course, not all organizations are the same – we certainly see differential utilization rates across teams – there is an opportunity for us to do more to even this out.
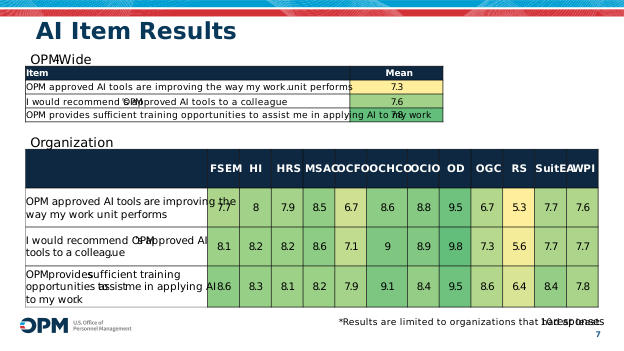
We also asked what is preventing employees from adopting AI more broadly, and time is certainly an issue. We have created some free time for individuals to work on AI skills, but we need to find more ways to address this. The following slide shows responses across identified barriers, and survey takers could choose up to three.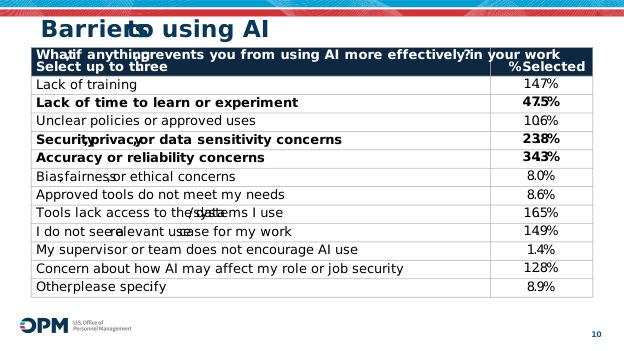
Some of the other objections – worried about privacy and security or results accuracy – are simply educational issues. There should be zero privacy/security impediments to utilization – employees are not responsible for vetting the tools. If our CIO team rolls out a product for your use, it is no different than using any other software product on your work computer – the exact rules that you follow for anything else apply to AI. We would not provide you an approved product if our team wasn’t confident that they had properly vetted any security or data privacy issues.
Results accuracy is a similar issue. Of course, you cannot just take the answer AI gives you and submit that as your final work product, any more than you would submit a presentation developed on Powerpoint or a spreadsheet developed on Excel without checking your work. AI is no different – it is a tool to make your job more efficient, but not a substitute for your own judgment and review of your work product. I guarantee you that using AI to help you jumpstart your next written document, research project, slideshow, etc., will yield much greater efficiency than the alternative. But that doesn’t obviate the need for you to proofread and pressure test your final work product.
Give it a try – you just might like it.